Counting the Cost of COVID Part II: Comparing to Past Crises
Updated July 8, 2020
In the first blog post in this series, I delved into the wisdom and morality of government debts, deficits, and aid from a Christian perspective. I concluded that incurring debt is often unwise and sometimes even immoral, but as long as the government has the ability to repay their debt, and the norm is a balanced budget, debt can justifiably be incurred. The Bible also teaches that individuals, families, and churches – not just governments – have significant roles to play in assisting the financially downtrodden.
In this second article in the series, we look specifically at the impact of recent public spending in response to COVID-19 on Canada’s financial state.
The sheer size of our current federal deficit means it will impact our country for decades to come. On July 8, the federal Department of Finance projected that Canada’s deficit would reach $343 billion by the end of the fiscal year. Three hundred and forty-three billion. And more spending might yet be announced in the second half of the year.
One way to grasp the magnitude of a $343 billion deficit is to try to count to 343 billion. I don’t advise it though. It would take you 10,869 years. Instead, it may be more helpful to compare Canada’s current deficit and debt to other times in Canada’s history.
Before evaluating the financial cost of COVID-19, I want to talk about how we should evaluate the cost. There are three ways to evaluate the cost of a government’s deficit.
The first way is the simplest. By how many (millions of) dollars did a government’s expenditures exceed its revenues?
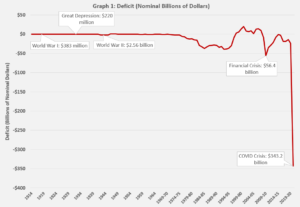 This first graph documents the size of the Canadian government’s deficit in nominal dollars, or the dollar value that would have been published in the news and reports in that year. Based on this first graph, you can barely even perceive that the Canadian government went into debt in the First World War, Great Depression, or Second World War.
However, measuring government spending like this poorly conveys Canada’s true fiscal situation. My grandpa often remarks that as a young man in the 1950s, he worked for a dollar a day. Obviously 60 years ago, each dollar was worth far more than it is now because of inflation.
This second approach, illustrated in this second graph, looks at the Canadian deficit after adjusting for inflation. Measured this way, the deficit during the World Wars and the Great Depression is more noticeable on the graph, but still not as high as during the Financial Crisis and certainly much less than our current COVID Crisis.
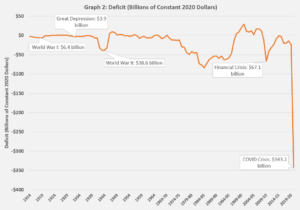 Is this the best way to comprehend our current government’s spending? Not yet. Although it better reflects the true magnitude of deficits in the past, it doesn’t account for increases in our collective wealth or standard of living over the years. Although the dollar a day that my grandpa earned back in the 1950s might be the equivalent to about $10 dollars a day today, the average person today earns a lot more dollars each day than the average person 70 years ago. The government in World War II spent far fewer dollars than the government during COVID because the total number of available dollars was smaller.
Which brings me to the third, and I think best, way to evaluate the current size of the federal government’s deficit: the debt-to-GDP ratio. GDP, or gross domestic product, measures the value of all the goods and services produced by an economy in a given year. In other words, it measures the overall size of the Canadian economy. In 2018, the Canadian GDP was $2.22 trillion.
The debt-to-GDP ratio tells us how much of the economic pie the government is eating with its deficits. This measure evaluates the size of the deficit relative to the size of the economy. This ratio is the standard measure that economists use to evaluate government deficits and debt.
Why use the debt-to-GDP ratio to measure deficits? Imagine two people incur a $1000 credit card bill. That’s a lot of debt for a student who only makes $7000 dollars a year. But the same bill is small for someone who earns $100,000 per year, all else being equal. Understanding a person’s income helps to put the magnitude of their debt into perspective. The debt-to-GDP ratio serves a similar purpose for evaluating the government’s deficits.
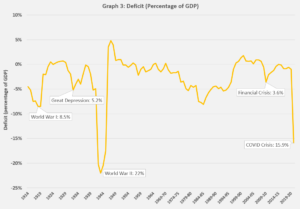 In this third graph, you can see that the World War and Great Depression deficits are far more noticeable, while the relative size of the COVID deficit is smaller. Measured this way, Canada’s spending was greater at the end of the Second World War than at any other time in history.
So, how does Canada’s current deficit compare to past deficits? The federal government is spending almost twice as much money today to combat COVID as it did to fight World War I at its height, three times as much as during the peak of the Great Depression, and four times more than during the worst year of the Financial Crisis. The only event that has ever prompted the government to spend more money than it is today is the Second World War.
Is all this spending necessary? Is the federal government effectively responding to this COVID Crisis? We justified the financial cost of fighting World War II; will we justify the financial cost of fighting COVID-19 when this is all over?
I’ll start to answer these questions next week, in the third installment of Counting the Cost of COVID.
Levi Minderhoud is the BC Manager for ARPA